First of all: fantastic program and a truly outstanding effort! I first used Dolphin memory engine a few months ago to find some RAM values for
Prince of Persia, The Forgotten Sands (Wii), but back then I shied away from also finding pointers to these values. Only today did I go back and
complete this task, thanks to the great "How to find a pointer path using Dolphin's debugger" tutorial in the original post (as well as, admittedly, some ChatGPT to help me understand, e.g., some assembly commands).
As such, I'd like to share what I learned in the process by writing up an updated and slightly more detailed tutorial on how to find pointers for Dolphin memory engine—written in a way which would've helped me as a beginner who was a bit intimidated by all the details. What is written below is far from perfect, and I can't guarantee that it is 100% correct or that it will work for everybody (that's just how it worked for me); but if nothing else this should complement the original tutorial by adding more context and, most importantly, translate it to Dolphin in the year 2025:
Tutorial for finding pointers in Dolphin
Table of contents
- 1. Setup: Dolphin's debug mode
- 2. First pointer search
- 2.1. Setting a memory breakpoint
- 2.2. Intermission: Some important assembly commands
- 2.3. Find a base address
- 2.4. Stable-pointer check
- 3. Multi-level pointers
- 3.1. Option 1: Rinse and repeat
- 3.2. Option 2: Read more assembly
1. Setup: Dolphin's debug mode
First, start Dolphin in debug mode. In Windows 11, this can be done by right-clicking in the folder where Dolphin.exe is located, following by clicking "Open in Terminal". Then run the command
.\Dolphin.exe -d
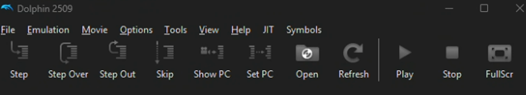
This should open an instance of Dolphin with some extra buttons (i.e., "Step", "Step Over", etc. to the left of "Open", "Refresh", ...).
Alternatively, create a shortcut to Dolphin.exe, then right-click on that shortcut > Properties, and add " -d" to the end of the "Target" field. Click OK and double-click the shortcut to start Dolphin in debug mode.
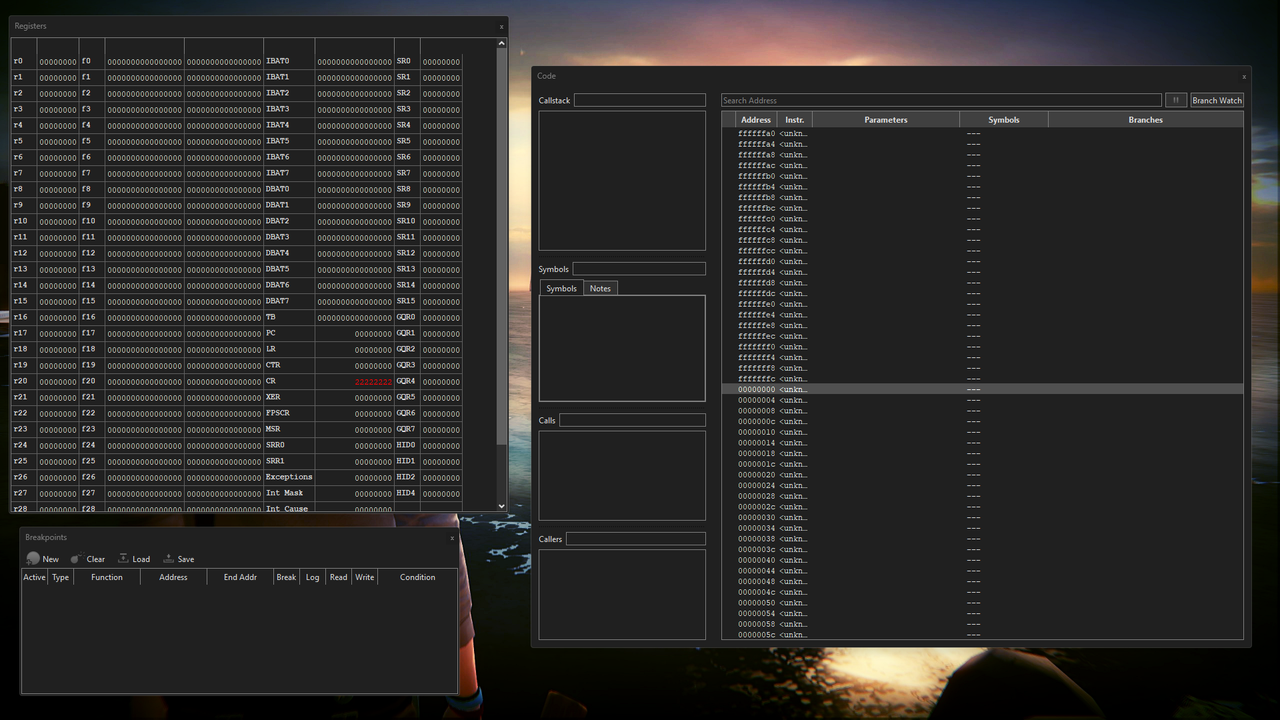
To search for pointers, we will need three extra windows from the "View" menu at the top of Dolphin: Click on View > "Code", "Registers", and "Breakpoints"
 2. First pointer search
I will assume that you have already found the RAM value that you want to find a pointer for. In this first example, I'll be searching for a stable pointer to the address 0x80C48B78, the Prince's z-coordinate in Prince of Persia: The Forgotten Sands (Wii), stored as a float.
Recommendation: Set a savestate here where your RAM value works, so in case something doesn't go as planned you have a "known state" to return to.
2.1. Setting a memory breakpoint
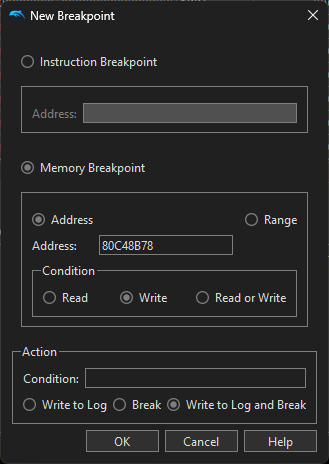
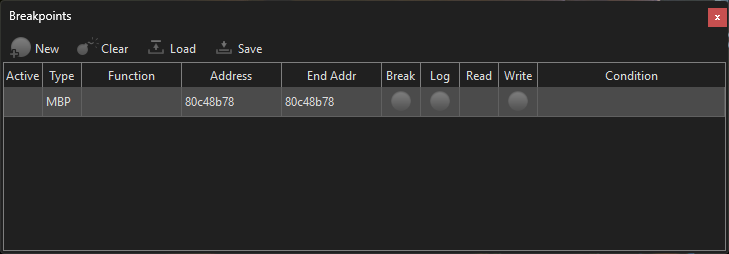
First, in the "Breakpoints" window click on "New" and select "Memory Breakpoint". Enter the address you want to find a pointer for (in our case 80C48B78). For "Condition" I went with "Write", but according to the original tutorial either read or write is fine.
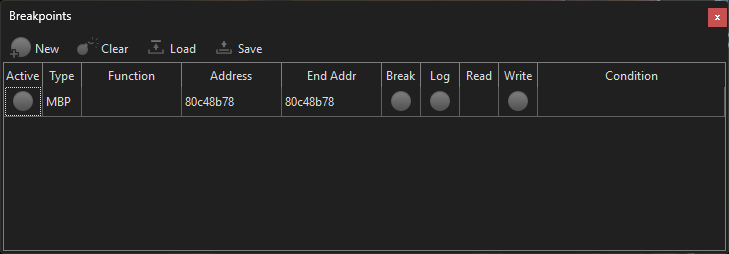
Click "OK". There should now be an entry of type "MBP" (memory breakpoint) in the "Breakpoints" window:
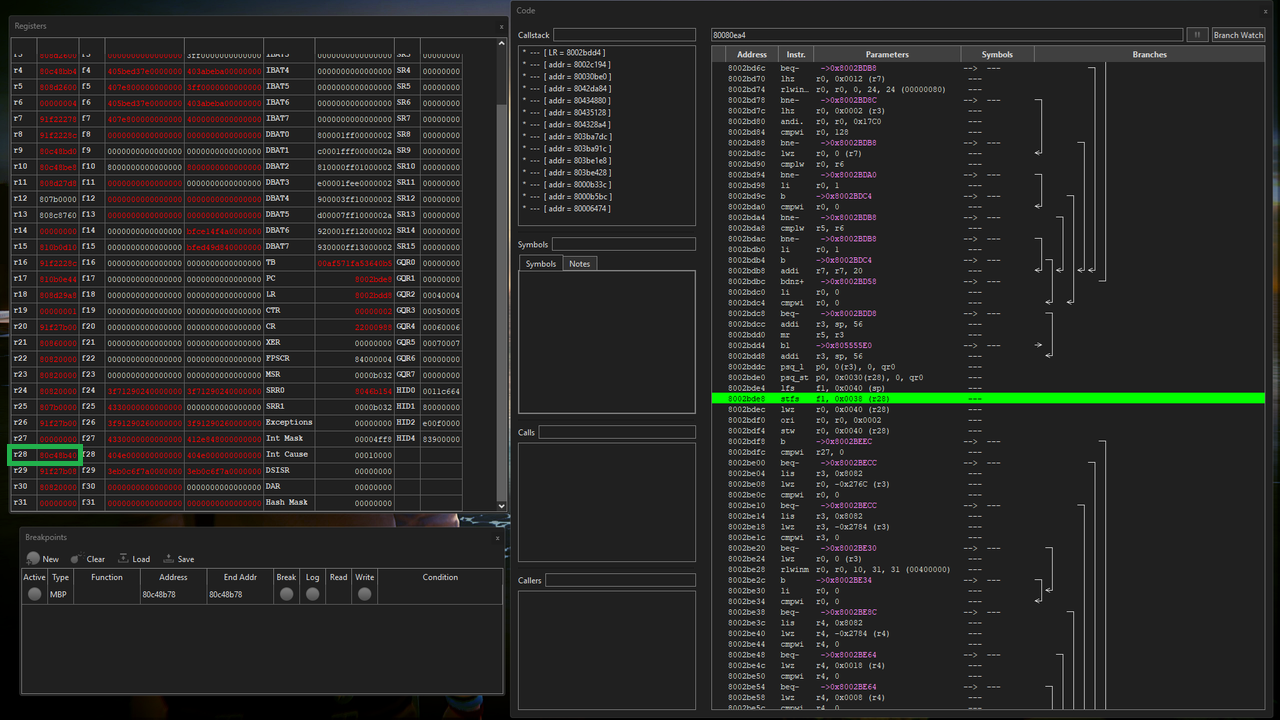
Next, play the game until a change in the variable you're investigating is triggered. (In our example, we're looking for a pointer to a coordinate, so moving or jumping should do the trick). Once the game has tried to access the address, the breakpoint will trigger, meaning the emulation will pause and the "Code" window and the "Registers" windows will fill up with all kinds of information. What is relevant to us is the line in the "Code" window that is highlighted in green.
Also, once this first breakpoint has triggered, deactivate it by clicking on the circle next to "MBP" in the "Breakpoints" window; the circle should then vanish and the line should be greyed out.
 2.2. Intermission: Some important assembly commands
Before continuing on with the highlighted instruction "stfs f1, 0x0038 (r28)", a quick glossary on the instructions you can encounter; you don't have to understand every aspect of it—what is important here is the basic distinction & syntax:
- "st[...]" (e.g., stfs, sth, ...) stands for "store", and the letters after "st" refer to what type of thing gets stored there. A typical command here looks something like
stw r0, 0x0004 (r4)
which means "look at the value in register 0 (r0) and store that value in the address stored in r4 (register 4) plus 0x0004". So if r0 at that time contains the value 144, and r4 is 0x80000000, then this command would store the value 144 at the address 0x80000004.
- "l[...]" (e.g., lwz, ...) most often stands for "load", and the letters after "l" again specify what get loaded where and how. A typical command here looks something like
lwz r5, 0x001C (r3)
which means "read the 4-byte value from memory at [what is currently in register 3 plus 0x001C], and store it in register 5". So if r3 at that time is 0x80000000, then this command read out the value at 0x8000001C and store that value in register 5.
- Sometimes, you may read an instruction like "lwz r0, 0x0380(sp)". sp is just a label for r1
- "mr" stands for "move register". A typical command here looks something like
mr r27, r3
which means "set r27 to whatever r3 is"
- "addi" stands for "add immediate". A typical command here looks something like
addi r11, r9, 112
which means "take what is stored in register 9, add 112, and store it in register 11"
- Other commands (like "cmp" = compare, etc.) we don't need and can ignore for the purpose of this guide
2.3. Find a base address
With this, back to our breakpoint. The green line in the above image contains the command "stfs f1, 0x0038 (r28)". The offset of 0x0038 will become relevant later, but what we need for now is the "r28" part: register 28 at the time of that instruction holds the value 80c48b40 (cf. the green rectangle I drew in the Registers window in the image above) so what this instruction says is "store the float f1 at the address r28 plus 0038". As a sanity check, r28 + 0x0038 (so in our case 80c48b40 + 38 = 80c48b78) is in fact the address we are pointer-hunting for.
Tip: while this particular hex addition was easy, for more involved computations I recommend
this hex calculator).
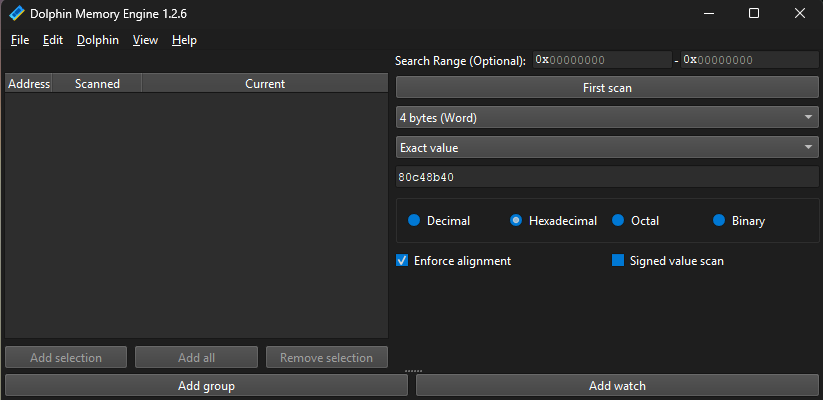
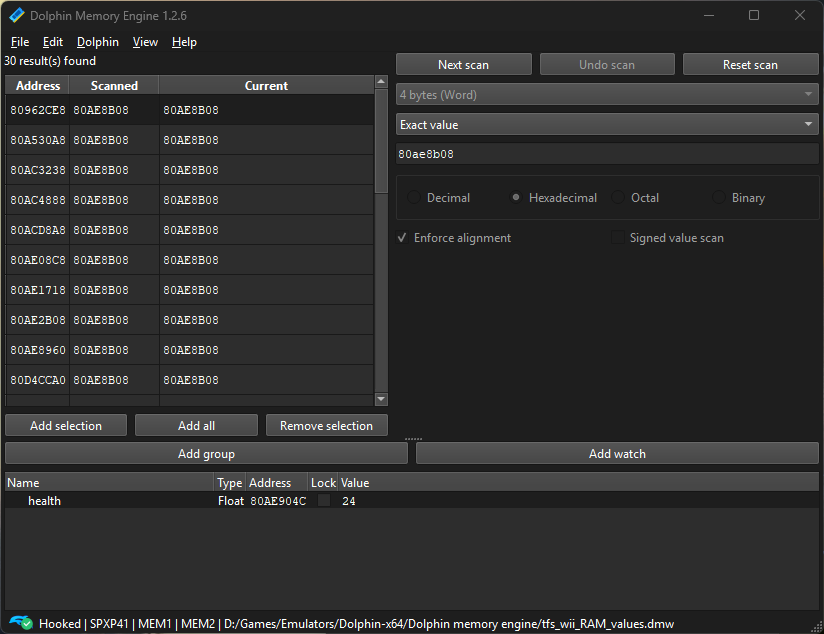
With this information we return to the Dolphin memory engine: we have to look for
stable addresses which
contain the value 80c48b40 from register 28. So start a scan for the exact 4-byte value "80c48b40" and select "Hexadecimal" below it, like so:
Then click "First scan". Usually, you will get more than one hit, in which case you may want to narrow it down a bit. Resume the emulation ("Emulation > Play" in Dolphin) and click "Next scan" multiple times to get rid of anything that fluctuates (i.e., is unstable or was just random hits; after all, we want a
stable base value). In our case, we got 8 initial hits:
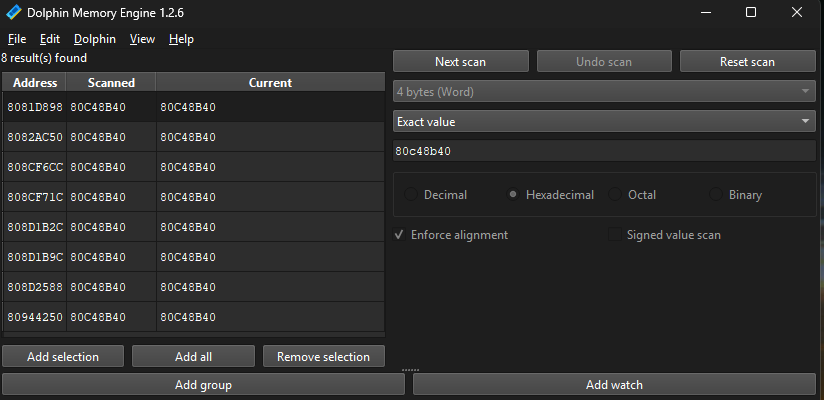
Of those, only three turned out to be stable—the others fluctuated or changed after a few seconds of gameplay:
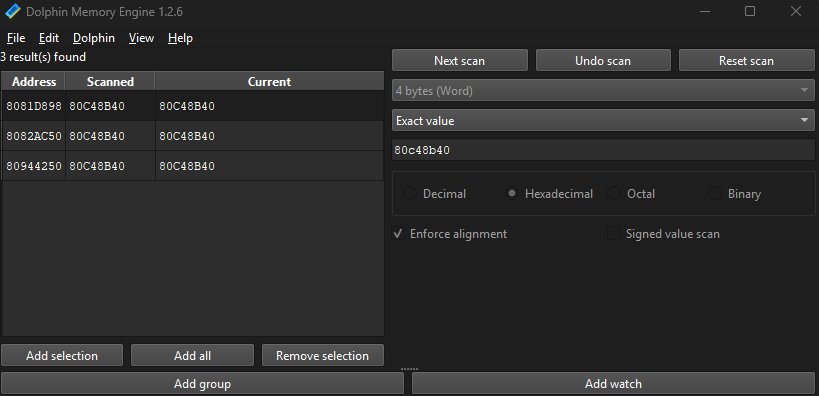
For our purposes, three hits is good enough and we can proceed to the next section. Even if you have way too many stable results you can move on to Sectoin 2.4. However,
if you want to narrow things down further, you can repeat the entire process up until now on a different save (
but keep your current Dolphin memory engine search): Find the base address which contains your value again, then set a memory breakpoint at that address, trigger the breakpoint, and enter the value of the corresponding register in Dolphin memory viewer's search field & click "Next scan". In theory you could repeat this until the number of hits does not change anymore. If one of your subsequent scans eliminated
all addresses and you now have 0 hits, jump to section 3 ("Multi-level pointers") down below.
2.4. Stable-pointer check
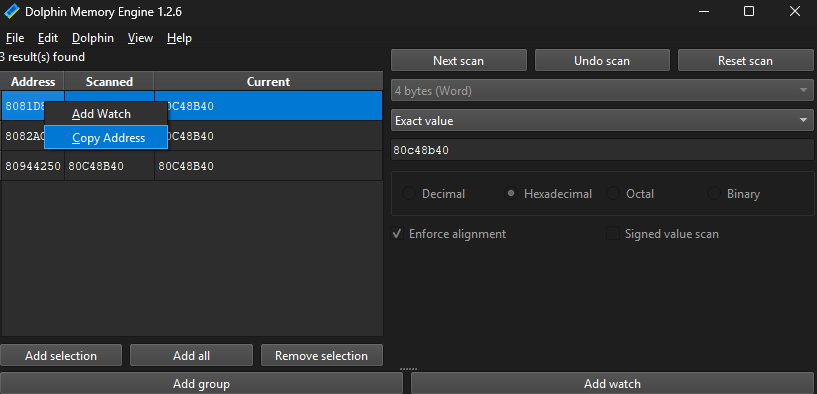
Now back to our example. We found three stable addresses: 8081D898, 8082AC50, and 80944250, meaning we can check whether any of them is a stable base for our pointer. To check this & to turn all this information into three pointers we do the following: First, copy each address (right-click > "Copy address").
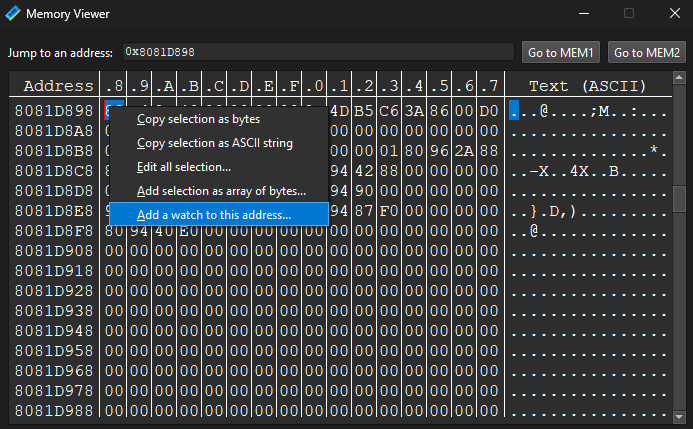
Then open the memory viewer (View > Memory Viewer) and paste the address into the "Jump to an address" field. In the memory viewer, right-click on that address (in our case 8081D898) and select "Add a watch to this address".
Alternatively, click "Add watch" in Dolphin memory engine and paste the address into the "Address" field.
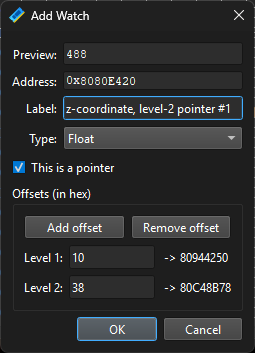
Then select the correct type of the value (in our case: float, because the coordinate in our game is a float) and click "This is a pointer". This will open an extra menu where you can add multiple levels of offsets. In our example, we currently only have one offset: 0x0038 (from the instruction in the "Code" window), so we only need a Level 1 offset where we enter 38:
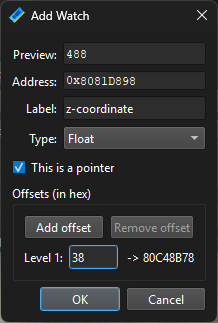
After clicking "OK" you should see a pointer in Dolphin memory engine's main window, signified by (1*) in front of the address because the pointer has one offset. Doing the same for all three addresses we found, we get the following list of pointers:
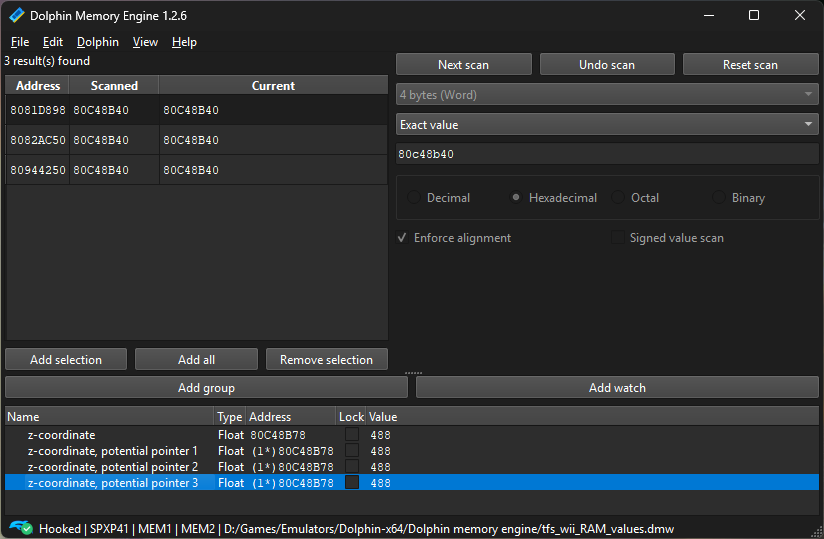
If any of these pointers always points to the value you're interested in—even after loading different saves or restarting the emulator—then congratulations, you have what is most likely a stable pointer to your address & you are done! In our example, the third pointer seems to work consistently and reliably through different saves.
If, however, all pointers you found throughout this section break at some point, we need to go one level deeper to pointers with
multiple offsets. This is what the last section will be about.
3. Multi-level pointers
What to do if none of the pointers we found in Section 2 are stable? In that case we have two options. The first one is simpler because it is mostly a repetition of what we did previously, while the second option is a bit more involved (but ultimately, potentially faster and more efficient).
3.1. Option 1: Rinse and repeat
Let's assume the pointer from our example in Section 2 broke and we are now looking for a pointer with two offsets. What this means is that the memory address we want to find a pointer to is
not our original address, but instead we want a pointer to one of the—at first glance stable—base addresses from Section 2.4. Translated to our example, we now want to find a pointer to the address 80944250 (from Section 2.4)—which, if successful, will become a two-level pointer to the original address 80C48B78.
First, load your savestate and repeat the entire process from Section 2, but now for the memory address 80944250 from Section 2.4.: Set a write-memory breakpoint at 80944250, resume emulation, trigger the breakpoint, and look at the green instruction in the "Code" window.
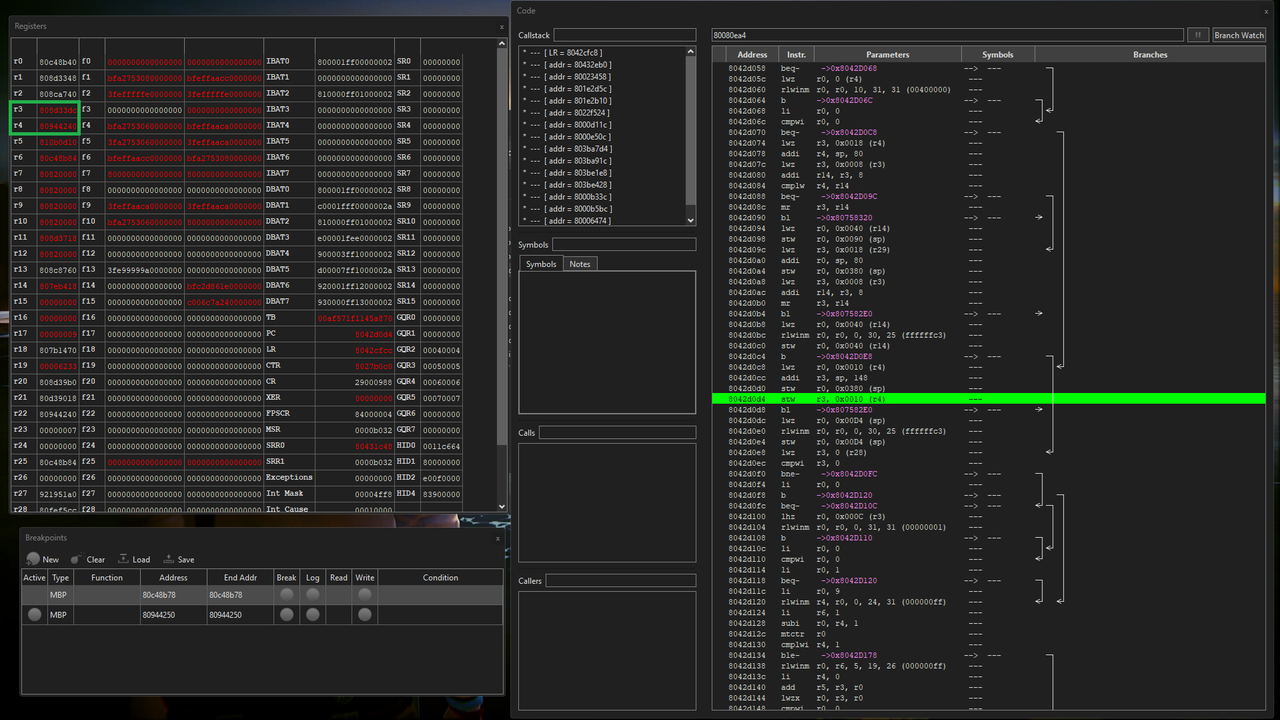
The highlighted instruction reads "stw r3, 0x0010 (r4)" which means "take the value from register 3 (80D48420) and store it in the address from [register 4 (80944240) plus offset 10]".
(Note that the instruction will likely look different from the instruction in Section 2.1., so recall the syntax of these instructions from Section 2.2).
But this instruction is problematic because it does
not pass our sanity check: although "register 4 plus offset 10" = 80944240 + 10 = 80944250 = the address we are trying to find a pointer to (this is good), the value in register 3 (80D48420) plus our first offset (38) is 80D48458, which is notably
not the address of the original z-coordinate (80C48B78)—this is bad. What this means is that this instruction is setting that slot for some other object/context, meaning it is not relevant to us.
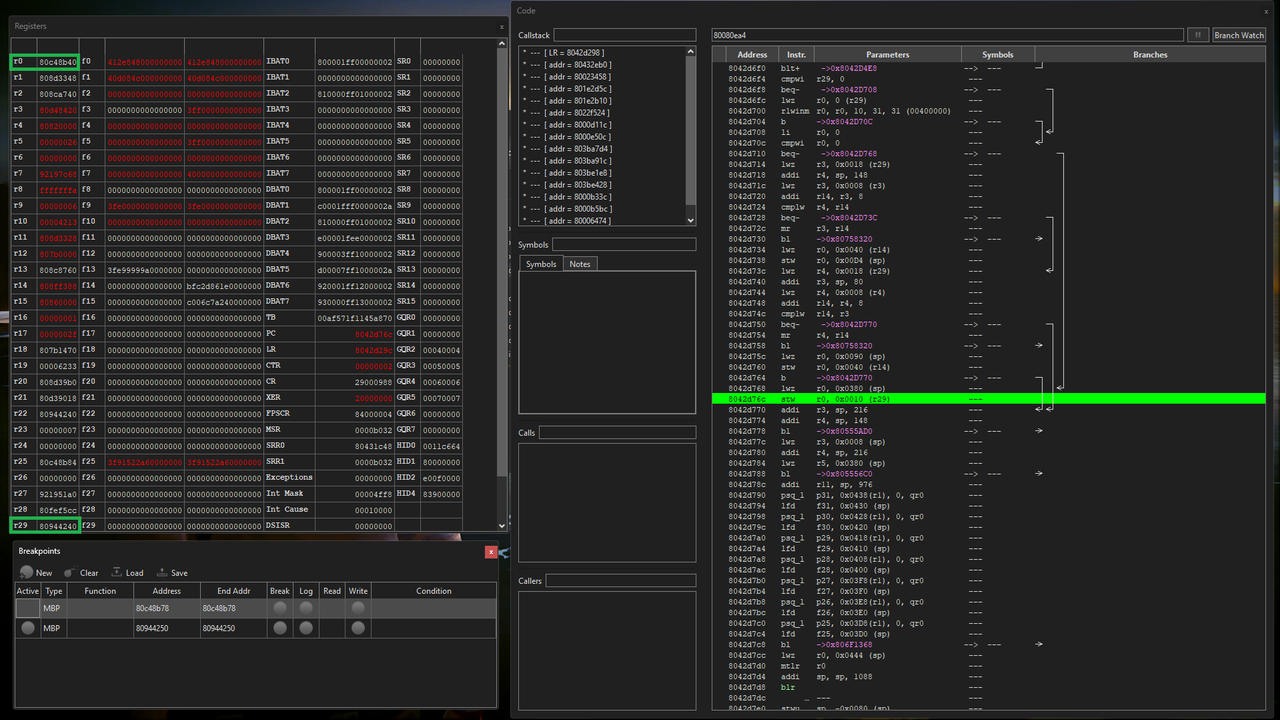
Hence we have to look for another instruction that writes to 80944250. Resume the emulation ("Emulation > Play" in Dolphin) and wait for the memory breakpoint to trigger again. In our example, this happens immediately, and the instruction it stops on is "stw r0, 0x0010 (r29)" where r0 = 80c48b40 and r29 = 80944240. This passes our sanity check, because r29 + 10 = 80944250 = the address we are trying to find a pointer to,
and r0 + our first offset = 80C48B40 + 38 = 80C48B78 = the address of the original z-coordinate.
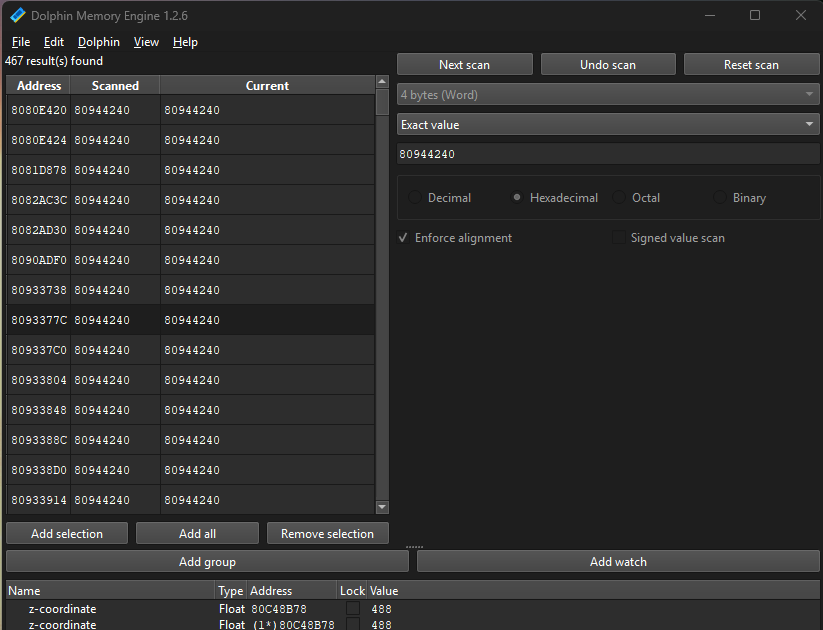
Next, we have to look for a stable address which contains the value "80944240" from register 29, so we start a search in Dolphin memory engine for the hexadecimal value "80944240" (recall Section 2.3). In our example we end up with 467 seemingly stable results, so let us just make pointers out of the first 8 addresses:
So copy address, click "Add watch", paste the address in the "Address" field, set type, and check "This is a pointer". Now for the offsets we need two levels: the first one is the offset from the current instruction (in our case: stw r0, 0x0010 (r29), so the first offset is 10). Then the second offset is the one from our "original" instruction/pointer, which in our example was 38 (Section 2.1./2.3.).
Repeat this for as many addresses as you want to test and see whether they are now stable throughout loading different saves and restarting the emulator.
Pro tip: Once you made the first of many pointers you can just copy and paste that entry at the bottom of the Dolphin memory engine multiple times, and all you have to do in the repeated entries is to double-click the address and change the "Address" field to whatever other base address you want to check.
If none of your addresses seem to work, repeat what you did in this section, but now for one of the seemingly stable addresses you found in your last memory engine search.
3.2. Option 2: Read more assembly
You may have noticed that for 3- or 4-level pointers, going through Section 3.1. multiple times becomes rather tedious quite quickly. There is an alternative approach which at first is more difficult—because it involves getting more information out of the assembly instructions in the "Code" window—but once you got the hang of it you'll find more complicated pointers much quicker.
To demonstrate this let us look at a different example. We now want to find the health value of the main character, which we already know is a float at address 80AE904C. (Don't forget to set a savestate here!) To find the relevant instruction which changes this health value we set a write-memory breakpoint at address 80AE904C (cf. Section 2.1.). Upon healing or getting hit, the emulator stops on the instruction "stfs f1, 0x004C (r29)" (with register 29 = 80AE9000).
Now instead of searching for addresses which contain the value 80AE9000 of register 29, the starting point of this approach is entirely different because it asks the question:
"Where is this value in register 29 coming from?". And our approach to answering this question will be to
follow the instructions in the "Code" window; doing so will eventually lead us to a stable base address for our multi-level pointer.
Here is what this means in practice: Scroll up in the "Code" window and look for the first
load command above our green line which has "r29" as its first parameter (that is, we are looking for instructions that start with an "l" and for which the corresponding entry from the "Parameters" column starts with "r29"). Recall from Section 2.2. that a load command with first parameter r29 means "load the value at address [??? (r??) + offset ???] into register 29—and this is exactly what we need because we want to understand where the value in r29 came from. For our example, this is the Code window with the relevant commands:
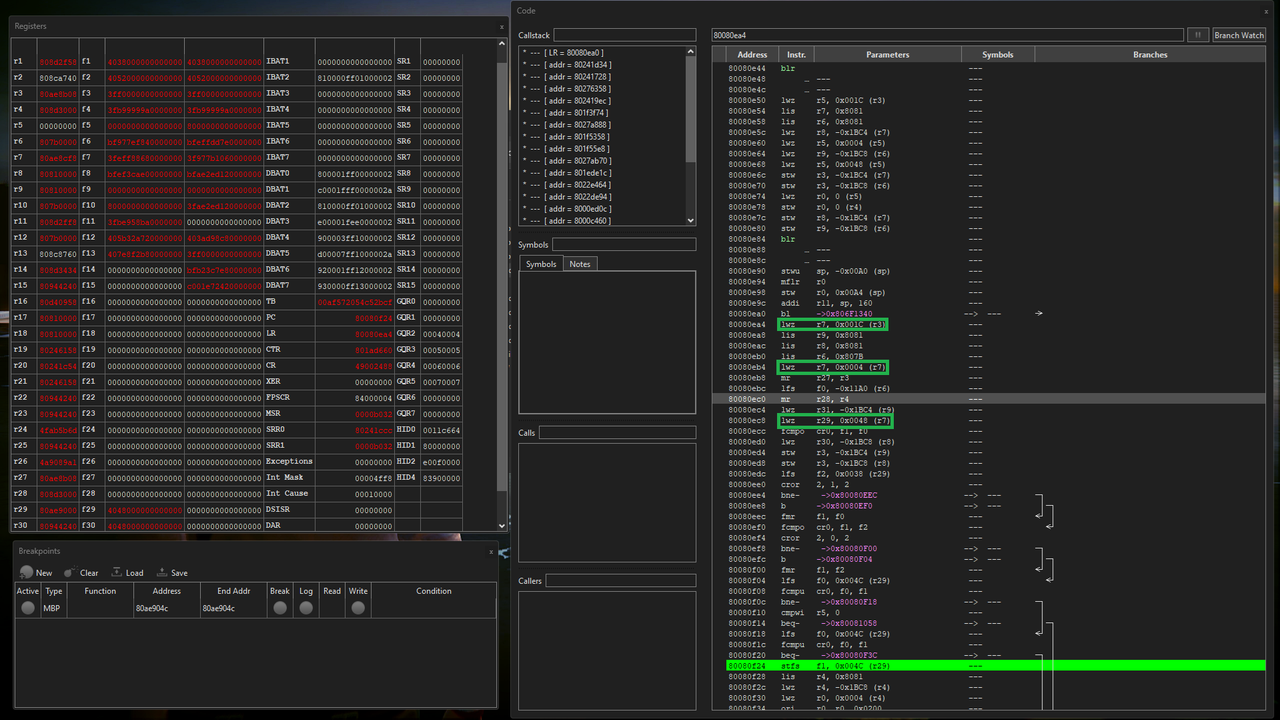
In our case, the command we are looking for is "lwz r29, 0x0048 (r7)" at address 80080ec8 (third green rectangle in the previous image). With this, we know that the value in register 29 came from register 7, so we ask our original question again: "Where is this value in register 7 coming from?". Scrolling up further, the load first command above lwz r29, 0x0048 (r7) which has r7 as the first parameter (i.e., loads something into register 7) is "lwz r7, 0x0004 (r7)" (second green rectangle in the above image). Because in the parentheses at the end it still says (r7), we continue to focus on register 7.
Spoiler: we will keep following this trail until we run into an instruction "lis", "addi", or "ori" which will relate to the base address of the pointer we are looking for. In our example, this is the chain of commands we landed on (in reverse order because this is the order we found them in; thus in the Code window the last command from that list was the furthest one up):
stfs f1, 0x004C (r29)
lwz r29, 0x0048 (r7)
lwz r7, 0x0004 (r7)
lwz r7, 0x001C (r3)
li r3, 103
lw r0, -0x1BC8 (r25)
lis r25, 0x8081
At this point I want to be clear that the emulator
may not have executed the commands in this order: in the code window you sometimes see pink instructions of the form "->0x...." which tells the instructions to jump to a different address and continue there (either always or if some previous condition is met). What this means for us is that some of these instructions we found may have nothing to do with the health value being changed, while other, relevant instructions happened somewhere else but then there was a pink instruction which made the command execution jump to our breaking point—which is another reason why this method is difficult to master, because it involves a slightly advanced understanding of assembly (and I guess also a bit of luck?).
Another quick intermission: Most of the relevant commands have been explained in Section 2.3, but some details I left out because they only become relevant when following instructions, as we are doing now:
- "li r3, 103" does not have a second register as an argument because it is a pseudo-instruction for "addi r3, r0, 103"
- "lis r25, 0x8081" means "set r25 to 0x80810000". Is often followed by something like "addi r25, r25, 0x001C" which sets the lower bits of the register. When finding commands like this, the corresponding value is a candidate for the base address of our pointer.
In any case, here is how to proceed: we have to choose one of these instructions and then essentially run our machinery from Sections 2. / 3.1. on that command (instead of on the first instruction "stfs f1, 0x004C (r29)" as we did in Section 2.). While we could try out any of the commands from our list, for our example I will choose the fourth command (
"lwz r7, 0x001C (r3)") because all commands up until then are
relatively close together, while the next one in the list ("li r3, 103") is a lot further up and also has some
big address jumps ("->0x8....") in between, meaning it is likely not related to our value. This means two things:
- We need to look for whatever is in r3 at the time of that instruction, and
- We need to write down the offsets from our chain of commands until that point from bottom to top, because these will be the offsets of our multi-level pointer later on:
1C, 4, 48, 4C
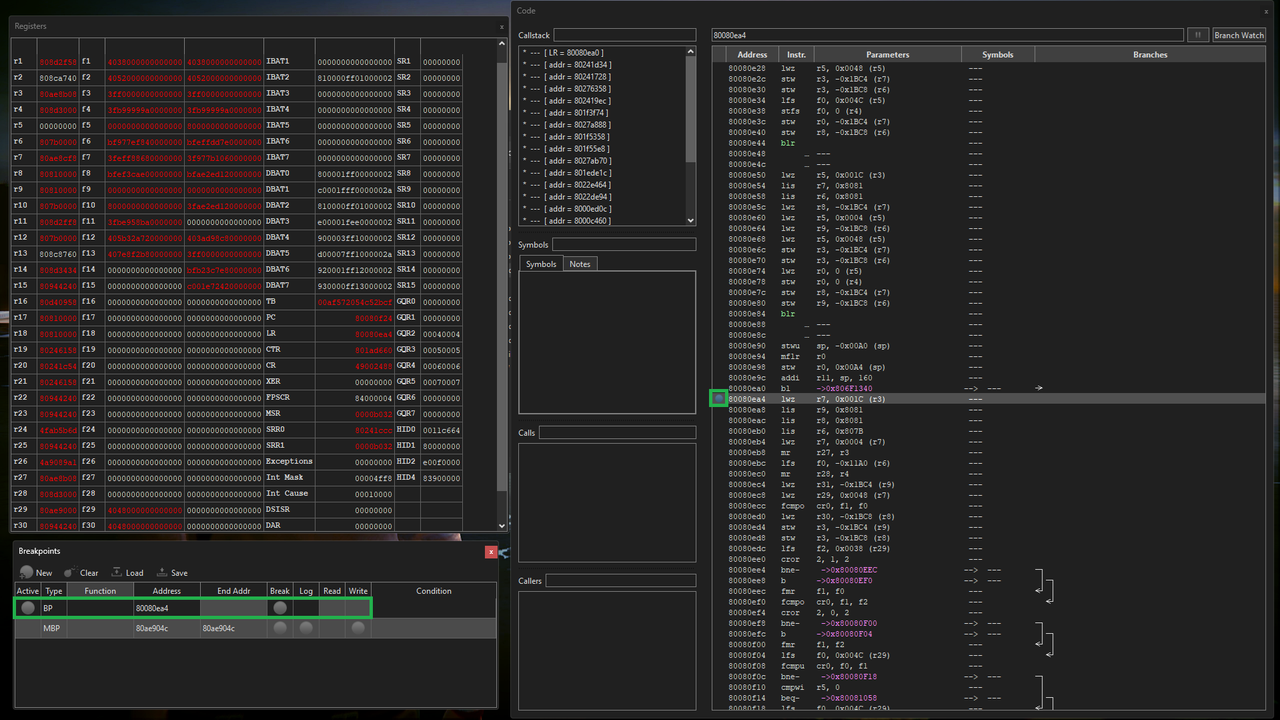
For the first task, we have to set a breakpoint at that very instruction ("lwz r7, 0x001C (r3)"). This is done by scrolling up to it and clicking to the left of the address of that instruction (in our case: left of the address "80080ea4" in the Code window). Things should look like this then; a blue point in the Code window and one active breakpoint in the "Breakpoints" window:
Resume the emulation ("Emulation > Play" in Dolphin) and trigger a change to your value (in our case: health so we again have to get hit or heal). If done correctly, the emulator should pause and the instruction where you set the breakpoint should now be green in the Code window:
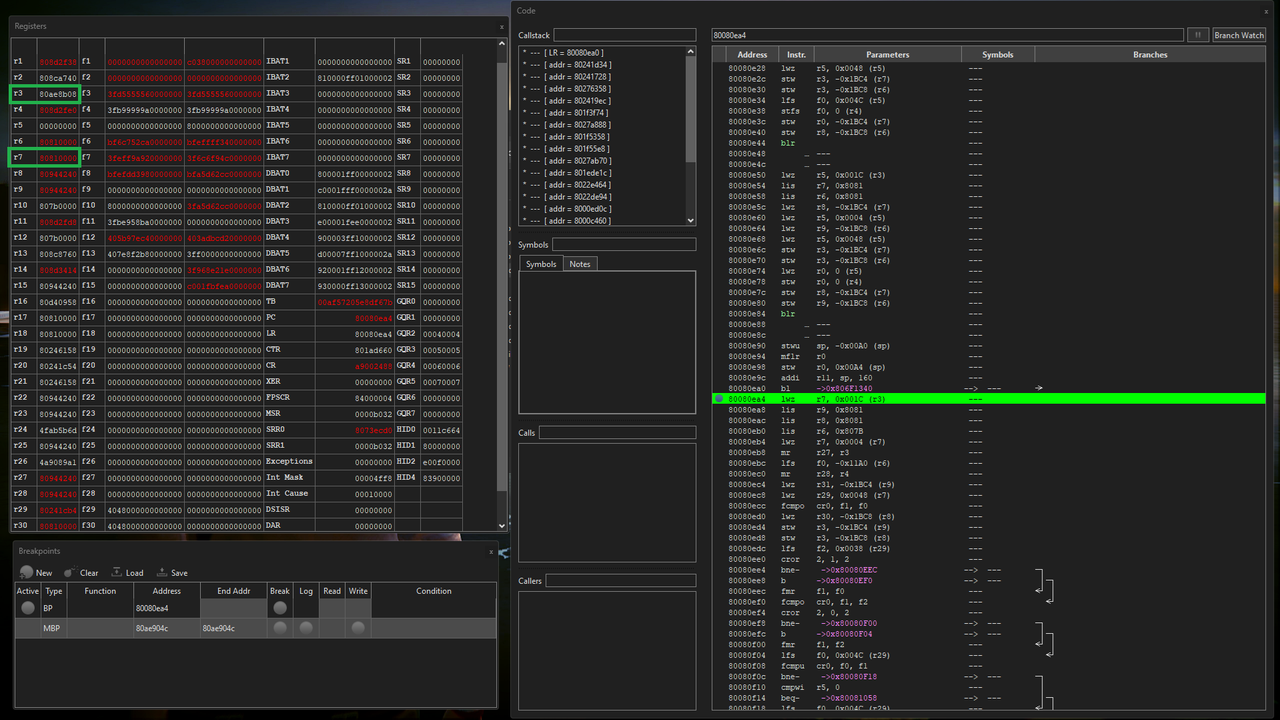
From the register we read that r7=80810000 and r3=80ae8b08 at the time of that command, so what the highlighted instruction says is "read the 4-byte value from memory at r3 + offset = 80ae8b08 + 1C = 80AE8B24, and store that value in register 7". Recall that we already knew what this instruction said, but the crucial new information is the
value in r3: 80ae8b08. This value we can now search for in Dolphin memory engine:
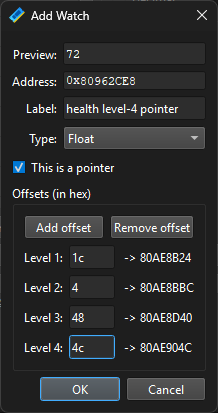
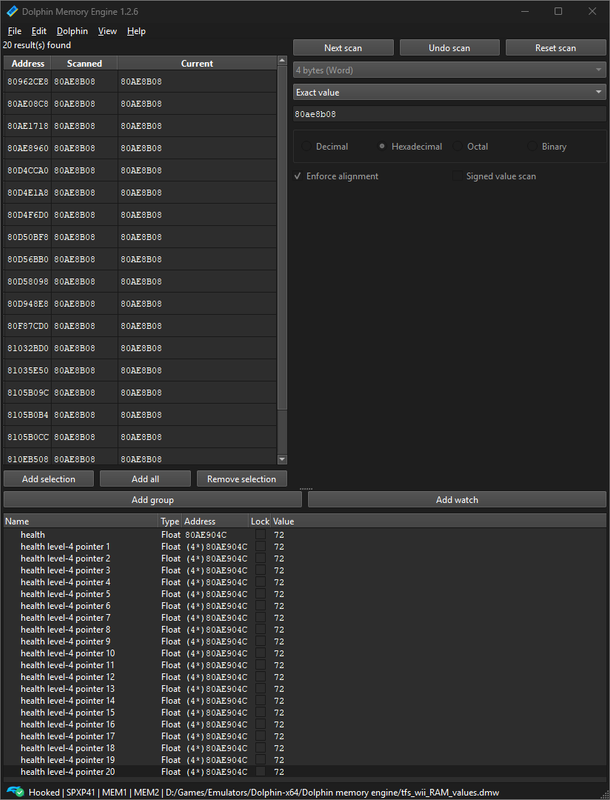
After removing all breakpoints, resuming the emulation for a bit, and removing all unstable values (by pressing "Next Scan" multiple times), we are left with 20 values that we can try out. For this we use the same procedure as at the end of Section 3.1.: copy one of the stable addresses, add a watch, paste the address into the "Address" field, set the type, and check "This is a pointer". The offsets we enter now are the offsets we noted down earlier (from the command chain), in our case: first
1C (because that's the offset on the command we set the breakpoint on), then
4 (the offset of the following command), then
48, then
4C.
Click "OK", then repeat this for as many addresses as you want to try out as base address for the level-4 pointer.
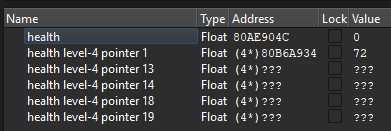
The final step is again to test stability of the pointers you found throughout loads and emulator restarts. In my case, of these 20 pointers only the very first one survived, but that particular one seems to indeed be stable so this example has been brought to a happy end:
It could of course happen that none of the pointers you found are stable. In that case, repeat the whole breakpoint procedure, but with a different command from the chain of instructions that you identified.
Finally, let me again give shoutouts to the
great original tutorial as well as the
explanation post on Dolphin's debugger, both by
aldelaro5. If anyone spots any mistake in what I wrote, please just let me know and I'll edit my post accordingly :)